

Imagine walking into a casino where every bet, every win, and every loss is written on a public whiteboard that anyone can read. That is essentially what on-chain analysis isthe process of extracting insights from the permanent, public ledger of blockchain networks. Unlike traditional finance, where bank statements are private and opaque, blockchain transactions are transparent by design. This transparency allows us to mine data directly from the source code of the network, revealing who is buying, who is selling, and how much value is moving around.
But raw blockchain data is messy. It’s a stream of hexadecimal strings, gas fees, and contract addresses that look like gibberish to the untrained eye. Mining this data means turning that chaos into clarity. Whether you are an investor trying to spot a market bottom or a developer checking for security flaws, understanding how to extract and interpret this information is no longer optional-it is essential.
What Is On-Chain Data Mining?
At its core, on-chain data mining is the systematic extraction of transactional information recorded directly on blockchain networks. When someone sends Bitcoin or interacts with a DeFi protocol on Ethereum, that action is broadcast to the network, validated by nodes, and added to a block. Once confirmed, it is immutable. It cannot be deleted or altered.
This permanence creates a unique dataset. According to industry standards, on-chain data includes blocks, transaction histories, wallet addresses, timestamps, miner fees, transfer amounts, and smart contract code. The key difference between on-chain and off-chain data is verifiability. Off-chain data might include trading volume on an exchange's internal ledger, which can be manipulated or faked. On-chain data, however, requires cryptographic proof. You know the transaction happened because the network consensus mechanism-whether Proof of Work (PoW) or Proof of Stake (PoS)-validated it.
For example, if you see a large transfer of Ethereum from a known exchange wallet to a cold storage address, you don’t have to trust a press release. You can verify it yourself using a blockchain explorer. This level of trustlessness is why institutions are increasingly relying on these metrics for due diligence.
The Technical Backbone: How Data Is Structured
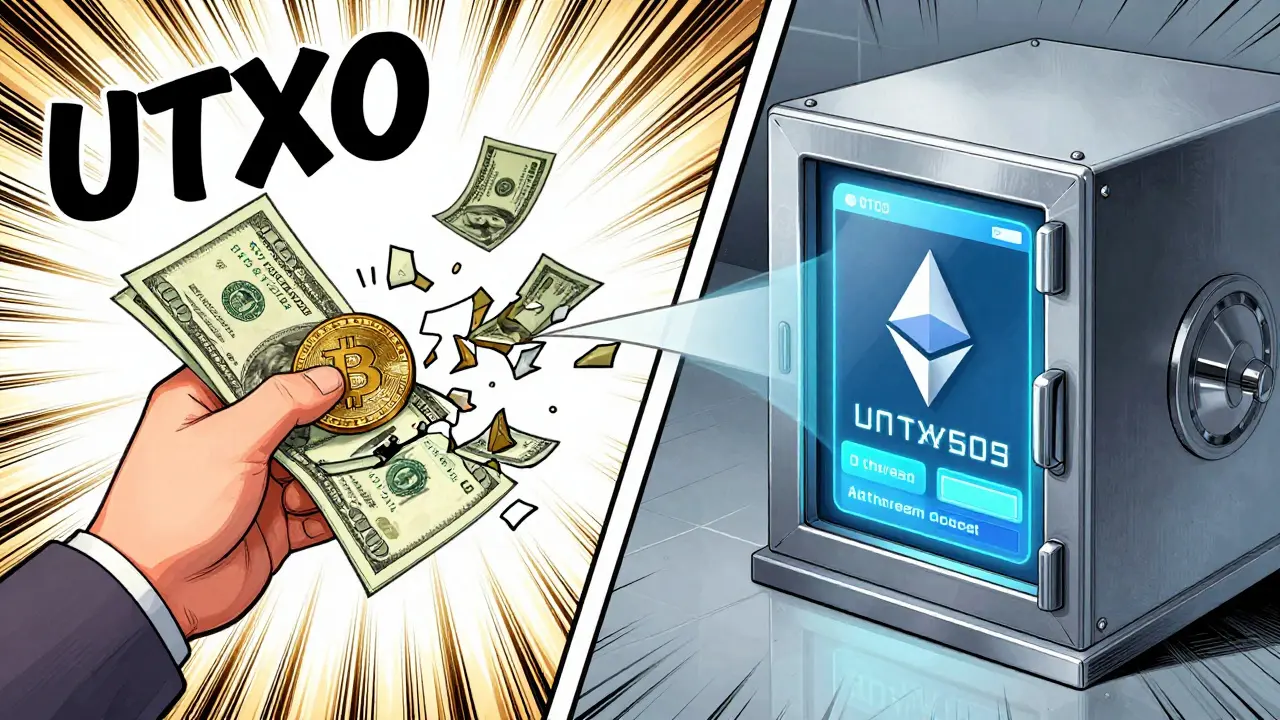
To mine data effectively, you need to understand the underlying architecture. Not all blockchains store data in the same way. The two most common models are the UTXO model and the account-based model.
- UTXO Model (Bitcoin): Think of this like physical cash. If you have a $10 bill and buy a $3 coffee, you get $7 back. In Bitcoin terms, the $10 is an Unspent Transaction Output (UTXO). The transaction consumes the $10 UTXO and creates two new ones: one for the merchant ($3) and one for change ($7). Analyzing Bitcoin involves tracing these outputs to see how coins flow between addresses.
- Account-Based Model (Ethereum): This works more like a bank account. Each address has a balance. When you send ETH, the sender’s balance decreases, and the receiver’s increases. This model makes it easier to track total balances but complicates things when smart contracts interact with each other.
These structural differences dictate how you extract data. For instance, calculating the "active supply" of Bitcoin requires counting all UTXOs, while doing so on Ethereum involves summing up account balances. Performance metrics also vary wildly. Ethereum processes roughly 15-30 transactions per second (TPS) with gas fees fluctuating based on congestion, whereas Solana handles thousands of TPS with near-zero fees. These differences mean your data mining strategy must adapt to the specific chain you are analyzing.
Key Metrics Every Analyst Should Track
Once you have access to the raw data, the next step is interpretation. Raw numbers tell you little; metrics tell you stories. Here are the most critical indicators used in professional on-chain analysis:
| Metric | Definition | What It Tells You |
|---|---|---|
| MVRV Ratio | Market Value to Realized Value | Indicates whether assets are overvalued or undervalued relative to their fair price. |
| SOPR | Spent Output Profit Ratio | Shows if sellers are realizing profits or losses. SOPR > 1 means profit-taking; < 1 means capitulation. |
| NUPL | Net Unrealized Profit/Loss | Measures the overall sentiment of the market. High NUPL suggests euphoria; negative NUPL suggests panic. |
| Active Addresses | Number of unique addresses sending/receiving funds | Gauges network adoption and user engagement levels. |
| Exchange Net Flow | Difference between deposits and withdrawals from exchanges | Positive flow often signals selling pressure; negative flow suggests accumulation. |
Take the MVRV ratio, for example. During the 2021 bull run, the MVRV ratio spiked above 3.5, signaling extreme overvaluation. Conversely, when it dropped below 1.0 in late 2022, it indicated that the market was deeply undervalued. By tracking these metrics, you move beyond guesswork and start making decisions based on historical patterns.
Tools of the Trade: From Free Explorers to Premium Platforms
You don’t need to run a full node to start mining data. The ecosystem offers a range of tools depending on your needs and budget.
For beginners, free blockchain explorers like Etherscan (for Ethereum) or Blockchain.com Explorer (for Bitcoin) are sufficient. They allow you to search for specific transactions, view token transfers, and check contract interactions. However, they lack advanced filtering and historical aggregation capabilities.
As your needs grow, you might turn to specialized analytics platforms. Glassnode is widely regarded as the gold standard for institutional-grade metrics, offering deep dives into HODL waves and miner behavior. Nansen focuses heavily on "smart money" tracking, labeling wallets belonging to venture capital firms, market makers, and successful traders. Their platform helps users identify which protocols are gaining traction before they hit mainstream news.
For developers who want to build custom dashboards, APIs from providers like CryptoQuant or direct access to Google BigQuery’s public blockchain datasets provide granular control. While powerful, these options come with a learning curve and significant costs. Enterprise access to BigQuery, for instance, can run hundreds of dollars monthly just for query processing.

Common Pitfalls and How to Avoid Them
On-chain analysis is powerful, but it is not infallible. One of the biggest mistakes analysts make is confusing activity with value. Just because there is high transaction volume doesn’t mean the economy is healthy. Dr. David Gerard, a prominent critic of blockchain hype, points out that a significant portion of Ethereum activity comes from arbitrage bots and wash trading, which generate data noise without creating real economic value.
Another pitfall is ignoring privacy-enhancing technologies. Coins like Monero use ring signatures and stealth addresses to obscure transaction details. Only about 1.7% of Monero’s transaction data is analyzable, making traditional on-chain methods nearly useless for this asset class. Similarly, Layer 2 solutions like the Lightning Network or zk-Rollups move transactions off the main chain, meaning you won’t see them in standard on-chain data feeds until they settle back to the base layer.
Data latency is also a concern. During periods of high network congestion, transactions can sit in the mempool (waiting area) for hours. If you are relying on real-time alerts for whale movements, you might miss the window or receive false positives. Always cross-reference on-chain data with off-chain context, such as regulatory news or macroeconomic trends, to get a complete picture.
The Future of On-Chain Intelligence
The landscape of on-chain analysis is evolving rapidly. We are seeing a shift from simple transaction tracking to complex behavioral analysis. Machine learning algorithms are now being used to classify wallets with greater accuracy, reducing false positives in whale alert systems by over 30%. Cross-chain analysis is becoming a priority, as assets move seamlessly between Ethereum, Solana, Polygon, and other networks via bridges.
Regulatory frameworks are also catching up. The EU’s MiCA regulation and guidance from bodies like the SEC require stablecoin issuers and exchanges to implement robust on-chain monitoring for Anti-Money Laundering (AML) compliance. This drives demand for enterprise-grade tools that can trace illicit flows across multiple jurisdictions.
Looking ahead, the integration of zero-knowledge proofs will present both challenges and opportunities. While ZK-proofs enhance privacy, they also enable privacy-preserving analytics, allowing entities to prove compliance without revealing sensitive data. As the industry matures, on-chain data mining will become less about finding hidden gems and more about verifying truth in an increasingly complex digital economy.
Is on-chain analysis reliable for predicting price movements?
On-chain analysis provides strong probabilistic signals rather than guarantees. Metrics like NUPL and MVRV have historically correlated well with market tops and bottoms. However, prices are also influenced by macroeconomic factors, regulations, and sentiment, which are not captured on-chain. Use on-chain data as one piece of a broader analytical framework.
Can I do on-chain analysis for free?
Yes. Basic analysis can be done using free tools like Etherscan, Blockchain.com, or Dune Analytics (which has a generous free tier). These platforms allow you to explore transactions, track tokens, and even create simple dashboards. Premium tools offer deeper historical data and automated alerts, but are not strictly necessary for beginners.
What is the difference between on-chain and off-chain data?
On-chain data refers to transactions recorded directly on the blockchain ledger, which are public and immutable. Off-chain data occurs outside the blockchain, such as internal exchange ledgers, social media sentiment, or traditional financial markets. On-chain data is more trustworthy for verifying asset movement, while off-chain data provides context for market drivers.
How do I identify "smart money" wallets?
Smart money wallets are typically identified by their consistent profitability and early entry into successful projects. Platforms like Nansen use machine learning and manual tagging to label wallets associated with venture capital firms, market makers, and profitable traders. You can also manually analyze wallets that consistently buy low and sell high across multiple cycles.
Does on-chain analysis work for privacy coins like Monero?
No, traditional on-chain analysis is largely ineffective for privacy coins. Monero uses cryptographic techniques like ring signatures and stealth addresses to obscure sender, receiver, and amount. Only a tiny fraction of its transaction data is analyzable, making it difficult to apply standard metrics like active addresses or whale tracking.
13 Responses
It is absolutely terrifying to think that every single transaction is permanently recorded on a public ledger for the elites to watch us. They are building a surveillance state where your financial privacy is non-existent and you can be tracked by the deep state algorithms. I refuse to use these systems because it is morally wrong to participate in such a transparent dystopia. The government wants to know exactly what you buy and who you send money to so they can suppress dissent. We must resist this digital panopticon before it is too late for our freedom. It is not about convenience, it is about control and subjugation of the individual will. Think about the implications of having your entire life mapped out in hexadecimal strings. It is a nightmare scenario that we are blindly walking into without question.
You people are completely missing the point of decentralization 🤡 It’s not about surveillance, it’s about breaking the banks! 🏦💥 Why do you even need privacy if you have nothing to hide? 😂 The real conspiracy is the fiat system stealing your wealth through inflation. On-chain analysis is just the tool to expose the fraudsters and wash traders who ruin the market for everyone else. Stop crying about privacy and start learning how to spot whale movements like a true alpha. 🚀📈
i mean look at the metrics table provided in the post its actually quite useful for understanding market sentiment. MVRV ratio is a great indicator for spotting tops and bottoms historically speaking. dont get me wrong privacy is important but ignoring the data available is silly. most retail investors just guess while pros use SOPR and NUPL to make informed decisions. its not magic its just math and probability applied to blockchain data. you can verify everything yourself which is better than trusting a bank statement that could be manipulated.
Bah! You call this 'analysis'? It's a parlor trick for nerds who think they've cracked the code of the universe with a spreadsheet! 🎪🃏 The market is a chaotic beast, not a predictable machine. These metrics are lagging indicators dressed up in fancy jargon to sell expensive subscriptions. Glassnode and Nansen are just snake oil salesmen preying on your fear of missing out. Real trading is gut instinct and chaos, not counting UTXOs like a medieval monk copying scripture. Wake up sheeple! 🐑💥
The entire premise of 'transparency' is a lie constructed by the central banking cartel to normalize their tracking mechanisms. When they talk about 'smart money,' they are referring to the algorithmic bots controlled by the same entities manipulating the stock market. You think you're analyzing data? No, you're feeding the hive mind. The gas fees are just a toll booth for the elite to extract value from the proletariat. Every transaction you make adds to your digital footprint, making you easier to target for social credit scoring. It's all part of the Great Reset agenda. Don't fall for the tech bro hype.
I understand the skepticism surrounding these new technologies, as it is natural for people to be wary of changes that affect their financial security and personal privacy in such profound ways. However, one must consider that the transparency offered by blockchain technology can also serve as a powerful tool for accountability and trust in a world where traditional institutions have often failed to provide either. By engaging with these platforms, we are not necessarily surrendering our freedom, but rather participating in a more open and verifiable economic system that has the potential to empower individuals globally. It is important to approach this with an open mind and a willingness to learn, rather than immediate rejection based on fear or misinformation.
Wow, what a drama queen attitude. Just use the tools or don't. Nobody is forcing you. 😒
Oh, how quaint. You believe that numbers on a screen hold any intrinsic truth about human behavior? 🙄 The philosopher knows that value is subjective, yet you cling to MVRV ratios as if they were commandments from Mount Sinai. It is amusing to watch humans try to quantify chaos with linear models. But sure, keep counting your UTXOs while the real world burns. At least you have your little charts to comfort you in the end times. 📉😂
it is deeply troubling that society is moving towards a cashless future where every penny is tracked. this lack of anonymity is a violation of basic human rights. we should be ashamed of ourselves for allowing this to happen. the moral decay of our society is evident in our willingness to trade privacy for convenience. think of the children and their future in a surveillance state. we must stand firm against this evil trend. :(
Stop whining and start earning. If you cant handle the transparency you deserve to lose money. Its simple really. Get off my lawn.
Listen up noobs 👂 Most of you are using free tools like Etherscan and thinking you are analysts. Pathetic. Real pros pay for Nansen and Glassnode because time is money 💰. If you cant afford the premium API access you dont belong in this game. Stop looking for shortcuts and start investing in your education. The matrix rewards those who pay attention to detail. 🧠✨
While the technical explanation of UTXO versus account-based models is accurate, it fails to address the critical ethical implications of data mining on privacy coins. How can we justify the intrusion into Monero transactions when only 1.7% is analyzable? This selective visibility creates a two-tiered system where privacy advocates are penalized. We must demand regulatory frameworks that protect user anonymity regardless of the blockchain architecture used. Transparency should not come at the cost of fundamental civil liberties.
I think it is interesting how different cultures view privacy. In some places, community oversight is valued over individual secrecy. Blockchain might bridge that gap by offering a middle ground. It is good to see people discussing both sides of the argument calmly. Learning together helps us all adapt to these new technologies better.